In part one of this series, we discussed how PROFINET leverages IT protocols such as Simple Network Management Protocol (SNMP), File Transfer Protocol (FTP), and Hyper Text Transfer Protocol (HTTP) to provide easy configuration and diagnostics over the network. In part two, we covered PROFINET device naming, PROFINET Discovery and Configuration Protocol (DCP), and Link Layer Discovery Protocol (LLDP), which makes network management a cinch. Now, in part 3 we’ll cover PROFINET application layer device diagnostics and alarms, data records, and additional features, which give us complete accessibility and control in the event of a diagnostic or issue with the network. We often refer to this as “diagnostics down to the wire” which we’ll explain in detail below.
PROFINET devices support a diagnostic hierarchy which cannot only notify the user of an issue on a device but also can isolate the location of the issue within the device. This is a priceless benefit as it gives you the ability to find the error quickly. It could be a device-wide issue, a problem with a network port, a module fault, or a channel within a module for instance. Not only are you informed where the alarm occurred in the device, but you are also given some error information about the type of the alarm and an error code. Examples could be a diagnostic alarm like a wire break, process alarm such as an over temperature in a running process, or a network alarm where a port got unplugged from the device.
Every PROFINET device has to be modeled in a standard way, and this is described in the device GSD (General Station Description) file, which is imported prior to device 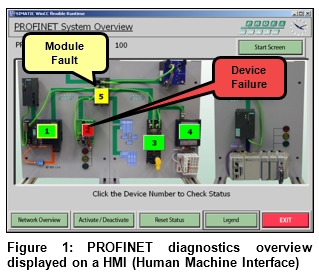 configuration into the PROFINET engineering tool. A list of supported diagnostics and standard PROFINET errors, including manufacturer specific errors are included in the GSD file. Some modules might have diagnostic settings which are changeable by the user during configuration, allowing a custom tailoring of the settings for your application.
Once your system starts up, in the event the diagnostic condition occurs in a device, an alarm is sent to the PROFINET controller as well as being stored locally in the device. The user can then react to it in the user application if needed. The diagnostic information can also be read out with a tool by maintenance directly using read/write record services.
Part of the PROFINET application layer diagnostics come in the form of standard data records which are always present in the device. PROFINET data records can be read from a configuration tool or IO supervisor/controller at any time using a read record service. These records can contain diagnostic information, IO information, parameter sets, device information and more.
To explain this: a common issue is a configuration fault. The user did not setup the device with the proper configuration and it does not match the real configuration in the device. An example would be if the user configured the wrong device such as a variable frequency drive (VFD) instead of a valve and attempted to start it with the IO controller. The IO device would detect that the startup data was not matching its real identity and the device at startup would signal a configuration fault to the IO controller. The error could be read out using “Application Log Data”.
Another example would be if the user configured the correct device, but didn’t configure all of the modules properly also signaling a fault for the incorrect modules. The engineer could verify this by comparing in the engineering tool or by reading device diagnostics the “Module Diff Block” which would show a difference. And finally, there are many other diagnostic and information records available to provide information on the latest diagnostic error, log data, identification and maintenance (I&M0) information such as part number, serial number, firmware revision, input and output data status, and more. A few records even can be written to, for example, the user could add further identification information, like installation date, whom to call if there is a problem with the device, location, etc.
In conclusion, PROFINET has the most collective and comprehensive diagnostics suite available of any Industrial Ethernet protocol and its focus is to be simple. This helps make it easy to manage your network, implement diagnostics in your applications, and keep downtime to a minimum. And PROFINET supports diagnostics not only at the application layers but also on the network which is a unique feature of the technology.
To learn more and see how simple it is firsthand, attend one of our hands-on PROFINET Certified Network Engineer classes (North America) or here (internationally) in the near future.
 Continue your education by completing a PROFINET Certified Network Engineer Course.
These certification classes are intense, hands-on courses. You will learn how the underlying technology works from the application to the frame level. After passing both a practical and written exam, you become certified.
For more information, contact us or visit our website.