One of the strengths of fieldbuses and industrial Ethernet protocols in general, and Profibus and Profinet in particular, is the diagnostic information. This diagnostic information can prevent downtime and accelerate Profinet troubleshooting.
First, an explanation of the technologies: Profibus and Profinet International (PI) created, support, and maintain the Profibus and Profinet standards. Both specifications are part of IEC 61158. Profibus is one protocol over two different physical layers: RS-485 for Profibus DP in discrete applications and Manchester-encoded, bus-powered (MBP) for Profibus PA in process applications. Profibus PA includes power delivery over the bus and is suitable for hazardous environments. Profinet runs on IEEE 802.3 wired (and fiber) Ethernet and IEEE 802.11 wireless Ethernet. Profibus integrates into Profinet using a proxy. (A proxy is like a gateway in that it connects and maps two disparate networks, but unlike a gateway, proxies are defined in the Profinet specification.) The proxy concept has been so successful that it has been extended to Interbus, DeviceNet, Foundation Fieldbus, and many others.
Profibus and Profinet use multiple means to help prevent and recover from downtime. The first line of defense is alarms, which can be announced on a human-machine interface (HMI). Alarms are available on:
- Process variables (e.g., zone 1 high temperature)
- Connected hardware (e.g., wire break on digital output 7 [heater on])
- Control devices (e.g., rack 1, module 3 is missing)
The protocols themselves define and support the alarms. In addition, the protocols convey diagnostic information about the variables being communicated: a “flag” accompanying a variable from a process instrument indicates if the value is good or suspect. Furthermore, the protocols notify and convey asset management information that can be used for predictive maintenance or condition-based monitoring.
And finally, information about the network itself is available. The network configuration tools from the controller manufacturer can be used as a first-line diagnostic tool. For a Profibus network, special-purpose tools are available for ad hoc or permanently connected monitoring of the network. Similar tools are available for Profinet. In addition, for Profinet, standard information technology (IT) protocols can be used to monitor the network. These protocols can display alarms and conditions in an HMI as well.
When devices need to be replaced, there are two methods available to speed the task. If a Profibus PA device needs to be replaced and a generic profile is used, set the address and replace the device—even if the device is from a different manufacturer! Profinet offers “Simple Device Replacement,” where a device can be replaced without setting an address or using a configurator or computer. Simply replace the device, and the controller locates and activates it. Profibus devices have manually adjustable dual in-line package (DIP) or rotary switches; Profinet settings are all made electronically.
New projects use Profinet, but there are still more than 50,000,000 nodes of Profibus installed, with more added every year. Profinet provides a larger address space, faster speeds, and is future-proofed because it leverages Ethernet. It also adds additional diagnostic capabilities beyond Profibus. But we will start with Profibus network diagnostics, and then see how Profinet builds upon them.
Profibus DP Troubleshooting Diagnostics
For Profibus DP, the first line of diagnostics is alarm status. Alarms can be generated from the process and from the hardware. Figure 1 shows the hardware alarms.
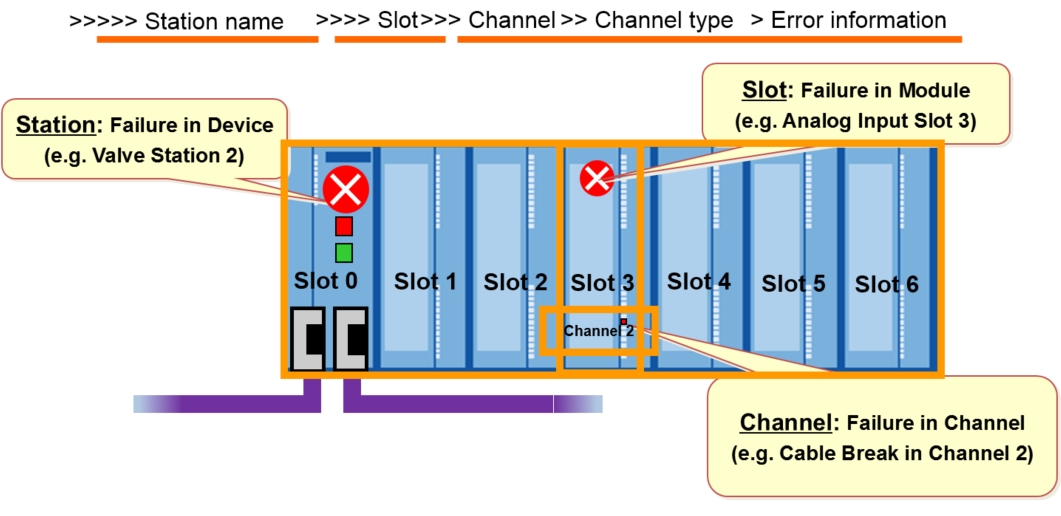
Figure 1. Hardware alarms
There are tools to check the network in both static and run-time modes. Static physical layer test tools can detect many types of wiring errors:
- swapped wires
- broken wire
- short circuit lines A-B
- short circuit A/B-shield
- open in shield
- missing or excessive termination
- segment length
- reflections
Run-time analysis tools connect to an operational bus and perform:
- determination of a “live list” (all active stations on the bus)
- analysis of protocol for Profibus DP and PA networks and devices
- helps find startup problems
- collection of statistics for repeats, drop-outs, corrupted messages, etc.
- trigger functions/decoding/logging
Many vendors provide tools for Profibus DP (RS-485). Run-time analysis tools perform oscilloscope functions (such as wave forms, signal levels, and reflections) and network topology determinations, and assist in locating cabling errors, faulty devices, etc.
Profibus PA Troubleshooting Diagnostics
After alarms, which parallel those for Profibus DP, checking the network is a good troubleshooting starting point. Bus and protocol analyzers are available from multiple sources. Some devices can be permanently connected to the network and some are handheld for ad hoc use.
During operation, Profibus PA instruments carry a status byte with the process variable in every cycle. The status byte provides information regarding the “usability” of the process value. The status byte is considered an integral part of any input process variable, and it specifies the “quality/health” of the variable:
- good: value is a real process variable (PV)
- conditionally usable: may be of lower accuracy or may be a substitute value
- failure: value does not represent the PV due to an error
- function check/local override: device is under local control, maintenance, or performing a function check
- passivated (diagnostic alerts inhibited): device forced into an idle mode by operator
- The status byte also indicates the presence of a high/low limit warning or alarm with respect to the process variable value, and it provides information regarding the condition of the device:
- good: device OK, no maintenance needed
- maintenance required: based on the previous conditions, the “wear spare” will be exhausted in the medium term or faster than expected
- maintenance demanded: based on the previous conditions, the “wear spare” will be exhausted
- in the short term; maintenance needed in short term to guarantee availability
maintenance alarm: the “wear spare” is exhausted or a sudden defect occurred; maintenance required immediately - function check/local override: device is under local control, maintenance, or performing a function check
Asset management information:Vendors can build many capabilities into devices, including failure prediction (to improve asset availability) or detailed messages for the maintenance technician. Users can adjust boundaries to match their process as in this example:
Profiles: Profibus PA devices are provided with one of two types of application profiles. (An application profile is a file that is an object. It defines the characteristics of the instrument it accompanies.) The manufacturer-specific profile allows the manufacturer to extend the profile to include the uniqueness of its devices. But the generic profiles available for download from PI allow a device to be replaced with one from a different manufacturer. Using the generic profile is a clear benefit to the user if a device needs to be replaced and an exact matching device is not available.
Profinet Troubleshooting Diagnostics
Profinet uses the same alarm scheme that Profibus does (as in figure 1), then adds IT protocols like Hypertext Transfer Protocol (HTTP), Simple Network Management Protocol (SNMP), and Link Layer Discovery Protocol (LLDP). Because Profinet is just standard unmodified Ethernet, these protocols easily share the same infrastructure as Profinet.
HTTP: Many Profinet devices have internal web pages, so configuration and diagnostic information can be viewed with a simple Web browser.
SNMP: SNMP provides access to standard management information blocks (MIBs) in Ethernet switches, whether the switches are standalone or in an automation device like a controller. The MIBs contain useful troubleshooting and downtime prevention data, such as the number of retries on a particular port. This information can be accessed in an HMI, for example, using an SNMP OPC server.
LLDP: Support forLLDP is mandatory in Profinet. This protocol allows devices to know what devices are connected to their ports. Knowing this, the entire network’s topology can be retrieved and displayed. LLDP also enables one of the great downtime shortening features of Profinet.
Profinet – Simple Device Replacement: Simple Device Replacement allows Profinet devices to be replaced without having to set an address and without using a computer.
Summary
Comprehensive diagnostic information is available for Profibus and Profinet. Alarms, HMI screens, special-purpose tools, and standard IT protocols all have a place in preventing downtime and aiding troubleshooting. To prevent downtime, choose redundant networks, devices, and controllers. For white papers, videos, webinars, and additional documentation visit: https://us.profinet.com/profi-diagnostics/.
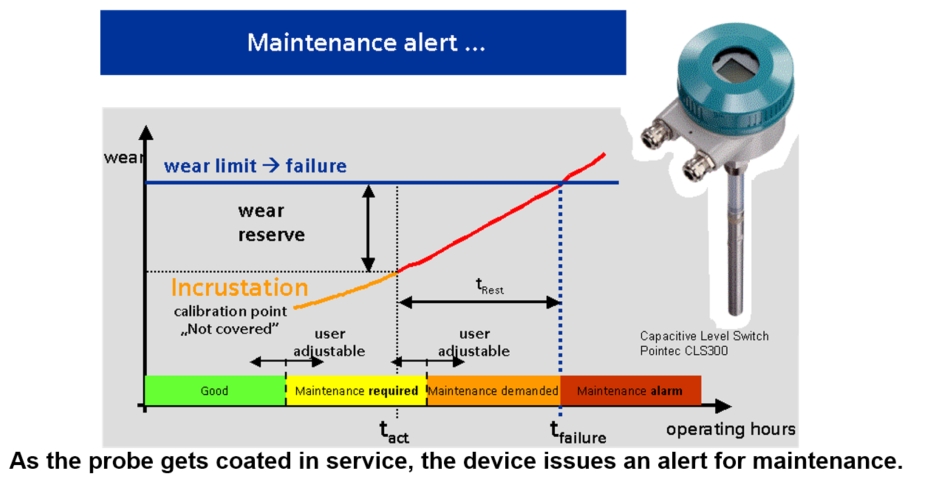
Figure 2. As the probe gets coated in service, the device issues an alert for maintenance.
This article originally appeared in InTech magazine as “Profibus and Profinet troubleshooting,
a comprehensive guide.”
 Continue your education by completing a PROFINET Certified Network Engineer Course.
These certification classes are intense, hands-on courses. You will learn how the underlying technology works from the application to the frame level. After passing both a practical and written exam, you become certified.
For more information, contact us or visit our website.